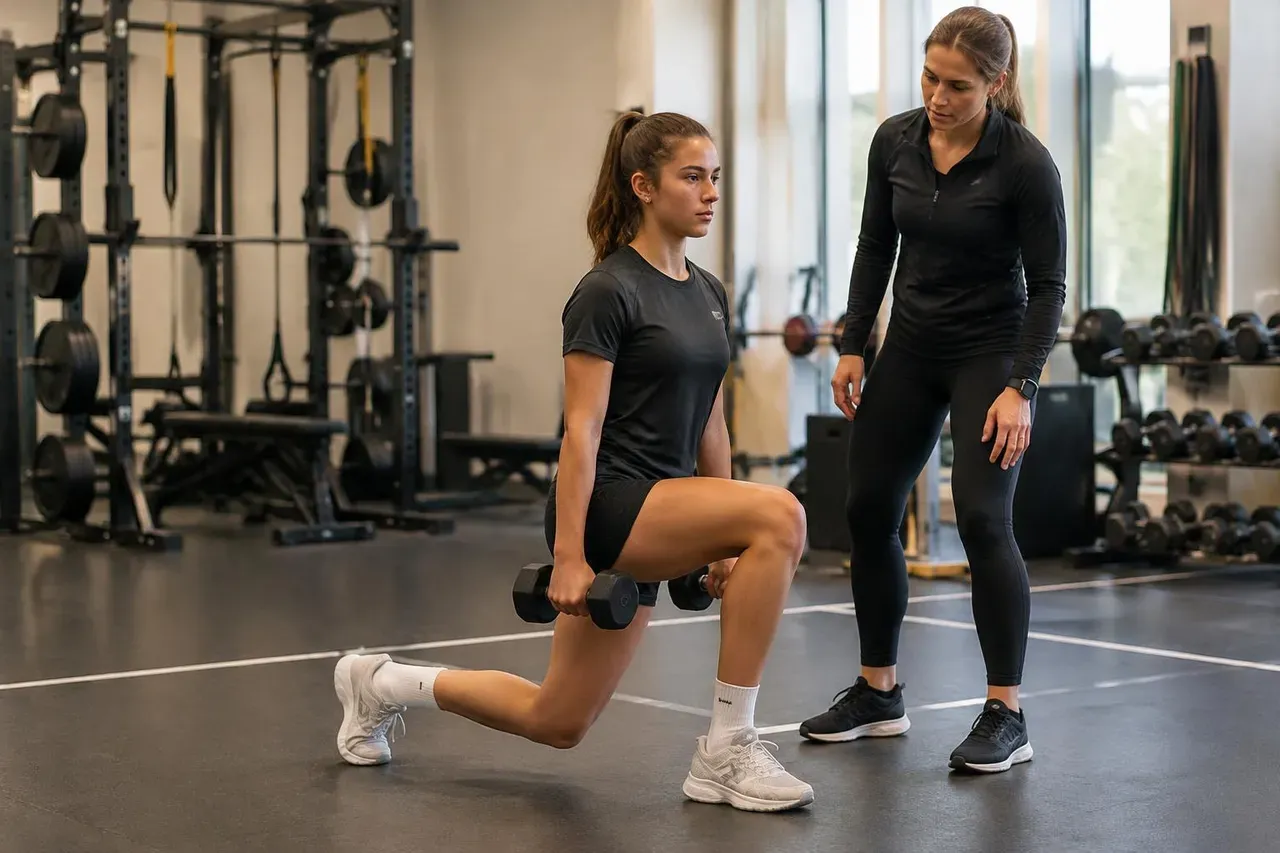
For thirty years, athletic strength was rated with a single number: the heaviest load you could lift once (1RM). Over the last fifteen years, biomechanics has dismantled that view. Explosive performance isn't only about how much force you produce — it's about how fast you apply it. The Force-Velocity Profile (FVP), popularised by J.B. Morin and P. Samozino, has become the reference tool to map that mechanic — and to actually individualise training.
Paradigm shift: why 1RM isn't enough
1RM measures one thing: what you can lift when velocity is zero. Useful, but it ignores the most decisive dimension of sport: time. Sprints, jumps, changes of direction and throws all happen in hundredths of a second. You don't need to be the strongest athlete — you need to express your strength the fastest. Two athletes can show the same peak power in the lab via opposite neuromuscular strategies: one force-dominant, one velocity-dominant. Without profiling, you prescribe the same session to athletes with opposite needs.
The equation: Power = Force × Velocity
On an isolated fibre, the F-V relationship is hyperbolic (A.V. Hill, 1938). But in multi-joint ballistic actions in vivo — jumps, sprints, ballistic bench press — the macroscopic relationship between mean external force and mean velocity is almost linear, with R² above 0.95 in trained athletes. Pmax sits at the apex of the parabola, when the athlete operates at 50% of theoretical F0 and 50% of theoretical V0.
The five key variables
F0: theoretical maximum force at zero velocity (N/kg). V0: theoretical maximum velocity with no external resistance (m/s). Pmax: F0 × V0 / 4 (W/kg), the global explosiveness index. SFV: slope of the profile, always negative — steep = force-dominant, shallow = velocity-dominant. FVIMB: gap between the athlete's real profile and the theoretical optimum for the task; this is what guides individualised programming.
Field measurement is now accessible
Vertical profile: 4–5 squat/countermovement jumps at progressive loads (body weight, +25%, +50%, +75%, ±100% of body mass). A linear encoder (GymAware, RepOne) or a calibrated smartphone app (MyJump2) is enough — with maximal concentric intent at every load. Horizontal sprint profile: 2–3 maximal 30 m sprints with strict standing start, split times via timing gates or MySprint. Upper body: ballistic bench-press throws (Rahmani-Morel-Morin, 2017), loads 30–70% of body mass. Smartphone caveat: a 2024 independent study showed Qwik VBT is the only barbell-velocity app currently validated against a 3D Vicon system; rigour of protocol matters more than the gadget.
Force deficit vs velocity deficit
Athletes are classified into five buckets from "high force deficit" to "high velocity deficit". Jiménez-Reyes (2017) showed that 9 weeks of profile-targeted training, just 2 sessions/week, cut the F-V imbalance by ~58% in force-deficit athletes and produced an average +14.2% jump height gain — versus marginal-to-zero results for the standardised control group. Generic programming leaves enormous performance on the table.
Hamstring injury risk through the FVP lens
Two biomechanical signatures stand out. (1) A chronic deficit in horizontal force production (FH0) in the lowest quartile correlates with significantly higher hamstring strain incidence in football and rugby. (2) Velocity-skewed profiles in the 90–100th percentile for V0/Vmax, especially when paired with anterior pelvic tilt at foot contact, drive eccentric strain past the muscle's elastic limit at late swing (Wolski, 2025). After hamstring or ACL surgery, isometric force can return to 100% while horizontal acceleration mechanics stay deeply impaired — return to sport shouldn't be cleared until FH0 is back to ≥ 95% of pre-injury values.
Programming from your profile
Force deficit → 3-2-1 ratio: 3 parts pure strength (squats 85–95% 1RM, deadlifts, heavy sleds), 2 parts force-power, 1 part pure power. Velocity deficit → mirror ratio: 3 parts pure speed (band-assisted jumps, reactive plyos, depth jumps, ballistic med-ball throws), 2 parts power-speed, 1 part power. Balanced profile → symmetric ratio across the whole curve to lift Pmax without distorting the slope. Eccentric for everyone → flywheel/kBox work once a week to condition deceleration capacity and protect tendons and ACL. Velocity-Based Training in autoregulation: warm-up bar speed sets the day's working weight; an unexpected drop at identical load is an early neuromuscular fatigue biomarker.
🎯 Map your Force-Velocity profile
Our 2-hour Full Assessment captures your vertical FVP (loaded squat jumps), RFD, left/right asymmetries, reactive strength index and — on request — your horizontal sprint profile over 30 m. You leave with your imbalance quantified, your relative Pmax, and a 9-week programme built around your actual mechanics — no guesswork.
Book the Full AssessmentKey takeaways
- ✅ 1RM measures force at zero velocity — not enough to describe sport power.
- ✅ Power = Force × Velocity; Pmax hits at 50% F0, 50% V0.
- ✅ Five variables matter: F0, V0, Pmax, SFV, FVIMB.
- ✅ Field-measurable with a smartphone (MyJump2, MySprint) or encoder — protocol > hardware.
- ✅ Profile-targeted training: +14.2% jump height in 9 weeks (Jiménez-Reyes, 2017).
- ✅ Low FH0 or velocity-skewed profile = hamstring red flag.
- ✅ Return to sport only when FH0 ≥ 95% of pre-injury baseline.